A multi-asset trading journal spanning broker accounts, prop firms and CFDs — built because every
journal I tried broke on the same thing. None of them could model how a trader actually holds
capital, and none of them could tell me the one thing I most wanted to know: is my edge real, and
am I leaking it?
So I built the thing I needed. Everything in it is measured in R — risk units — rather than
dollars, because dollars flatter a big account and punish a small one, and neither tells you
whether you're any good. I use it every day. It isn't a product. But enough of it works well
enough that I'm curious whether other traders want it too.
Most journals are a list of trades. That's not the problem.
Recording what you did is the easy half, and every spreadsheet on earth can do it. The hard half
is answering the questions that actually change your trading: is this pool of capital performing,
or is one account flattering the rest? Did I pass that challenge because the process worked, or
because I got lucky in the last week of it? Am I taking the same trade differently depending on
whose money it is?
You cannot answer any of that if your journal treats every trade as a row in one flat list. The
structure has to match how the money is actually held — or the numbers it gives you back are
confidently wrong.
“Recording what you did is the easy half. Every spreadsheet on earth can do that.”
How it's built
The structure matches how the money is actually held.
This is the part every other journal gets wrong, and everything downstream depends on it. If the
structure is wrong, the analytics on top of it are confidently wrong too.
01
Capital areas, each with their own rules
Prop money, broker money, long-term money. Different risk limits, different drawdown rules, different consequences for breaking them. Each area is configured and judged on its own terms, then rolls up into one view — so you can't quietly over-expose yourself across three accounts at once.
02
Prop accounts, challenge through to funded
A challenge, its verification and the funded account it becomes are one story. Most journals file them as three unrelated accounts, so the history resets exactly when it gets interesting. Here it runs continuously — which means you can finally see how you trade under challenge pressure versus how you trade once the money is real.
03
Strategies, tags and trade plans
Every trade belongs to a strategy and carries its own tags, so performance can be sliced by system, setup or market condition rather than lumped into one average that describes nobody. Trade plans are written before execution, not reconstructed afterwards.
What it tells you
The questions I couldn't get answered anywhere else.
Not features for the sake of features. Every one of these exists because its absence was costing
me money, and most of them are uncomfortable to read. That's rather the point.
01
Where would I be if I'd never touched it?
The one that stings. It replays your entire history under different management policies —
what you actually did, versus set-and-forget with the original stop and target untouched,
versus rules-managed to breakeven, versus scaling out — and shows you where the account
would have finished under each.
Most traders have never seen this number. A lot of them wouldn't enjoy it.
02
What did my discretion actually cost?
Rule adherence versus edge leak. It separates the trades where you followed your own entry
and exit rules from the ones where you improvised, and puts a dollar figure on the
difference. If overriding yourself is costing you money, you find out in a number rather
than a feeling.
03
Is my edge even clearing the costs?
The cost hurdle. Spreads, commissions and swaps mean you need a minimum expectancy per trade
just to break even. It calculates that hurdle and puts your gross expectancy next to it, so
a strategy that looks marginally profitable but is actually below the line has nowhere to
hide.
04
What win rate do I actually need?
Breakeven win rate, from your own asymmetry — your average winner divided by your average
loser. It tells you the win rate you need, shows the one you have, and gives you the gap.
Which is the whole "best loser wins" argument expressed as a single number: win small and
often and you lose, win big and rarely and you're fine.
05
Is the edge holding, or quietly degrading?
Expectancy stability over time, plus the full distribution of outcomes bucketed by R, and
hold time split across winners, breakevens and losers. Together they answer whether you're
cutting winners early — the most common and expensive habit in trading.
06
What have I stopped looking at?
The exit coach watches open positions and tells you when one hasn't been reviewed — "three
open watches, oldest is twenty-eight days." Forgotten trades are where accounts go to die,
and no journal I found would nag me about them.
The method underneath it
Grade the decision, not the result.
Every trade gets written up and graded on the decision, separately from what the P&L did.
Because a good trade can lose to something nobody saw coming, and a bad trade can win — and a
journal that collapses those two into one number will teach you the wrong lesson with total
confidence.
Each write-up also has to name what wasn't the problem. That single prompt has stopped
me filing more false lessons than anything else I do: it keeps a red result from poisoning a
sound process, and stops a green one laundering a lucky, improvised trade.
“A journal that flatters you is worse than no journal at all.”
The part I use most
It reviews your trading for you.
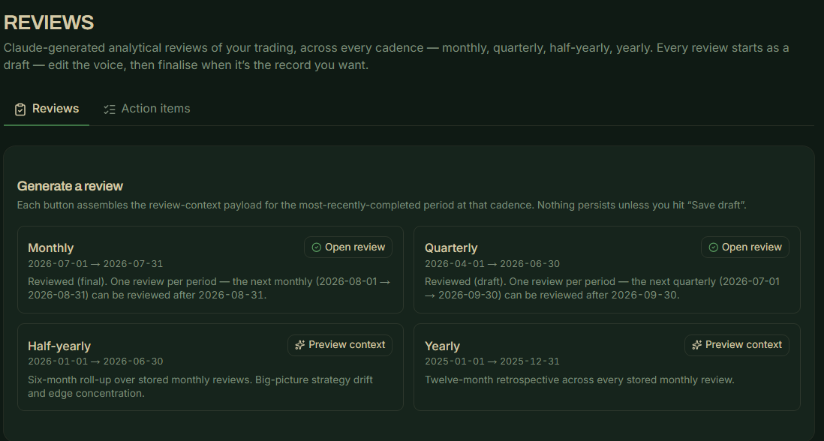
This is the feature I'd have paid for on its own. At the end of every period the journal takes
everything it holds — the trades, the grades, the rule breaks, the expectancy, the policy
comparison — assembles it into one payload, and has Claude write the review. Monthly, quarterly,
half-yearly and yearly.
It's the difference between having your data and actually confronting it. Most traders never sit
down and read their own quarter, because doing it properly takes hours and the findings are
unflattering. This does the reading and tells you what it found.
Four cadences, one click each. Every review starts as a draft you can edit before it becomes the record.
Monthly and quarterly
The close-range read. What actually happened in the period, which rules held and which didn't, and where the expectancy came from — one review per period, so the record is complete rather than selective.
Half-yearly
A six-month roll-up built over the stored monthly reviews. It's looking for the things you can't see from inside a month: strategy drift, and edge concentration — whether your whole year is really resting on two good trades.
Yearly
A twelve-month retrospective across every stored review. The one that answers whether you're actually improving or just having a good run in a friendly market.
“A draft first, so I can edit the voice — then finalise it when it's the record I want.”
Reviews are written to be argued with, not accepted.
There's an action-items view alongside it, so a review doesn't end as something you read and
forget. The findings become things to do.
A look inside
The dashboard.
Trade cards carry the full record — entry, exit, size, stop, target, risk-to-reward, risk taken,
net result, R-multiple, hold time and which account it belonged to — with the written post-mortem
sitting alongside the numbers rather than in a separate document nobody opens. Above it sits the
expectancy view, the R distribution, the profit calendar and the policy comparison.
Accounts, grouped by where they actually are. Funded and active, in challenge, and closed — with account size, phase progress and profit split carried on the row. A challenge that passes moves up rather than starting again. Balances blurred.
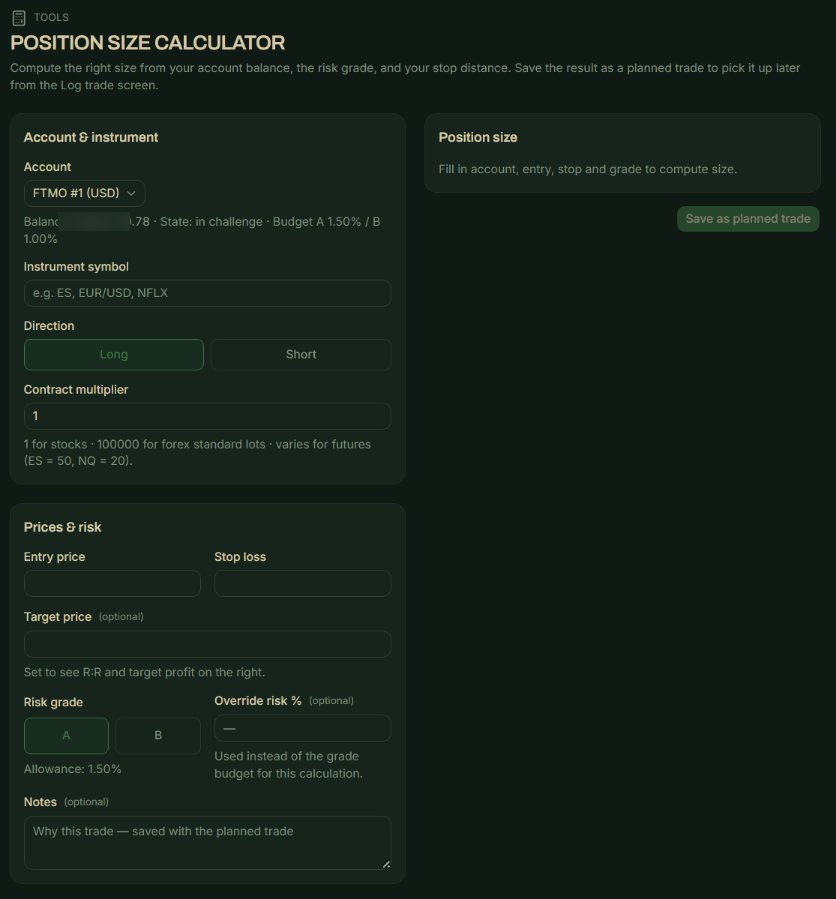
Sizing that knows which account you're in. The calculator reads the account's state and its risk-grade budget — an A-grade setup gets a different allowance to a B — then sizes from your stop distance and saves the result as a planned trade. Balance blurred.
More coming
Screenshots of the policy comparison, the exit coach and the profit calendar are on their way.
Straight up
Where this actually stands.
It is not for sale. There's no price, no waitlist you're being softened up for, and no launch date. If that changes you'll hear it here first.
It's built for one person, and that person is me. Which means it does exactly what I need and probably assumes things about how you trade that aren't true.
It isn't finished. The insight layer is actively being worked on. Some of it is very good. Some of it I've already rebuilt twice.
I'm showing it to find out if it's worth building properly. Making it into a product for other people is a serious amount of work, and I'm not doing that on a hunch.
Your feedback genuinely changes it. Not a marketing line — I've already changed how capital areas work because of one conversation.
Tell me what you'd want from it.
If you journal your trading — properly, badly, or not at all because everything you've tried was
useless — I want to hear it. What broke for you. What you gave up on. What you'd need before
you'd trust a journal with your whole book.
Leave your email and I'll come to you when there's something to look at. Or just write to me
directly and tell me what you think — that's more useful to me than a signup.